Media: data viz
I design things to support my work and others: exhibitions, architecture, furniture, hardware, and graphics. Making is a form of study—combining traditional techniques with new technologies to find low-cost, DIY methods that yield surprising qualities. I like artifacts that straddle boundaries: virtual/physical, analogue/digital, traditional/progressive.
About
I design things to support my work and others: exhibitions, architecture, furniture, hardware, and graphics. Making is a form of study—combining traditional techniques with new technologies to find low-cost, DIY methods that yield surprising qualities. I like artifacts that straddle boundaries: virtual/physical, analogue/digital, traditional/progressive.
Quantum Itineraries Live Visuals
A suite of tools and visualizations in Unity for live-generated 3D visuals projected behind performers at 8K for dome or classical displays, using procedurally generated meshes and shaders. I built the system for the Quantum Itineraries music performances, a festival featuring quantum computer music where quantum simulations are core to composition and instrumentation. The quantum simulation data that generated the music also drove the visuals directly, with WebRTC routing Unity's output to a mixer for the projection.
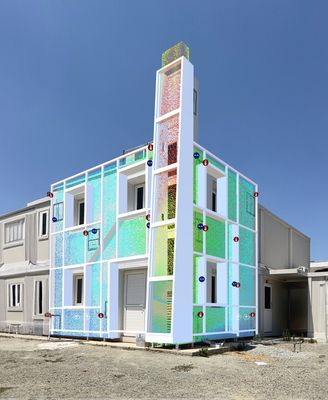
MESH AIRFLOW Visualization
An AR visualization of airflow patterns for a secondary facade system designed by the Cyprus Institute. I took the researchers' 2D computational fluid dynamics (CFD) simulations (heat and flow maps) and UV mapped them onto a 1:1 scale 3D model of the facade, then built a shader to animate these maps with particles, inspired by how Portal 2 visualizes fluid dynamics. In the final application, users scan a QR code on the test building and see the internal 'stack effect' in action, with callouts indicating sensor locations.
BEEP Energy Sim
An AR energy-use visualization that lets stakeholders view expected energy loads for every room in a heritage building over the year using a phone or tablet. A slider scrubs through a full year of data, built to explain green infrastructure investments for the adaptive reuse project. More information on the project can be found here.Technical: I baked 3D room volumes into an optimized mesh whose vertex UVs encode positions on a packed lookup texture for GPU-driven animation without CPU overhead. The project also showcased Wikar's 3D section slicer, which recomposes standard shaders into slicable equivalents using 3D SDF intersections with a stencil pass for back-face fill.
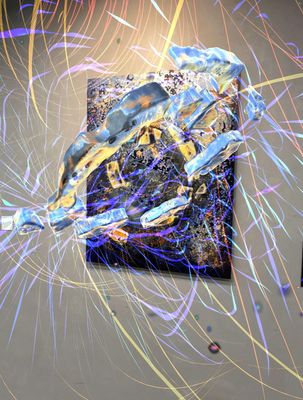
CryoLumens
An AR artwork representing the strength and location of Earth's magnetic fields using NASA's real-time sensor network, overlaying data-driven particle systems on an original painting using image tracking. When viewed through a phone, the painting comes alive with particles that shift and flow based on live magnetic field data. I developed the coding and visuals for Eli Joteva.Technical: Live sensor intensities are baked into packed textures so particles animate by interpolating a texture index on the GPU, keeping the visualization real-time without CPU overhead.
Earth Vis
An experiment in converting NASA climate data into a real-time VFX graph visualization. For this project, I built a system in Unity where a compute shader drives particles across a globe in polar coordinates, sampling precomputed flowmaps for wind speed and direction, while their trails change color based on temperature.
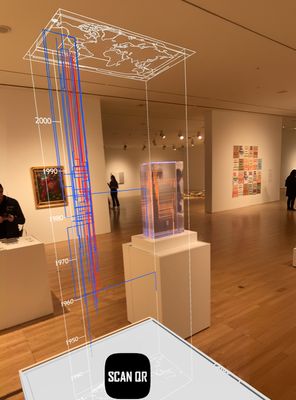
Timeline Atlas
Two AR data-visualization sculptures visualizing datasets too complex to depict through physical sculpture: the home locations of all female senators over the past century. I collaborated with artist Stephen Cartwright, known for meticulously logging personal data over decades and crafting it into acrylic sculptures that exhibit spatial-temporal patterns. We used AR to go beyond his traditional manufacturing techniques. Debuted as part of a faculty showcase in 2019.